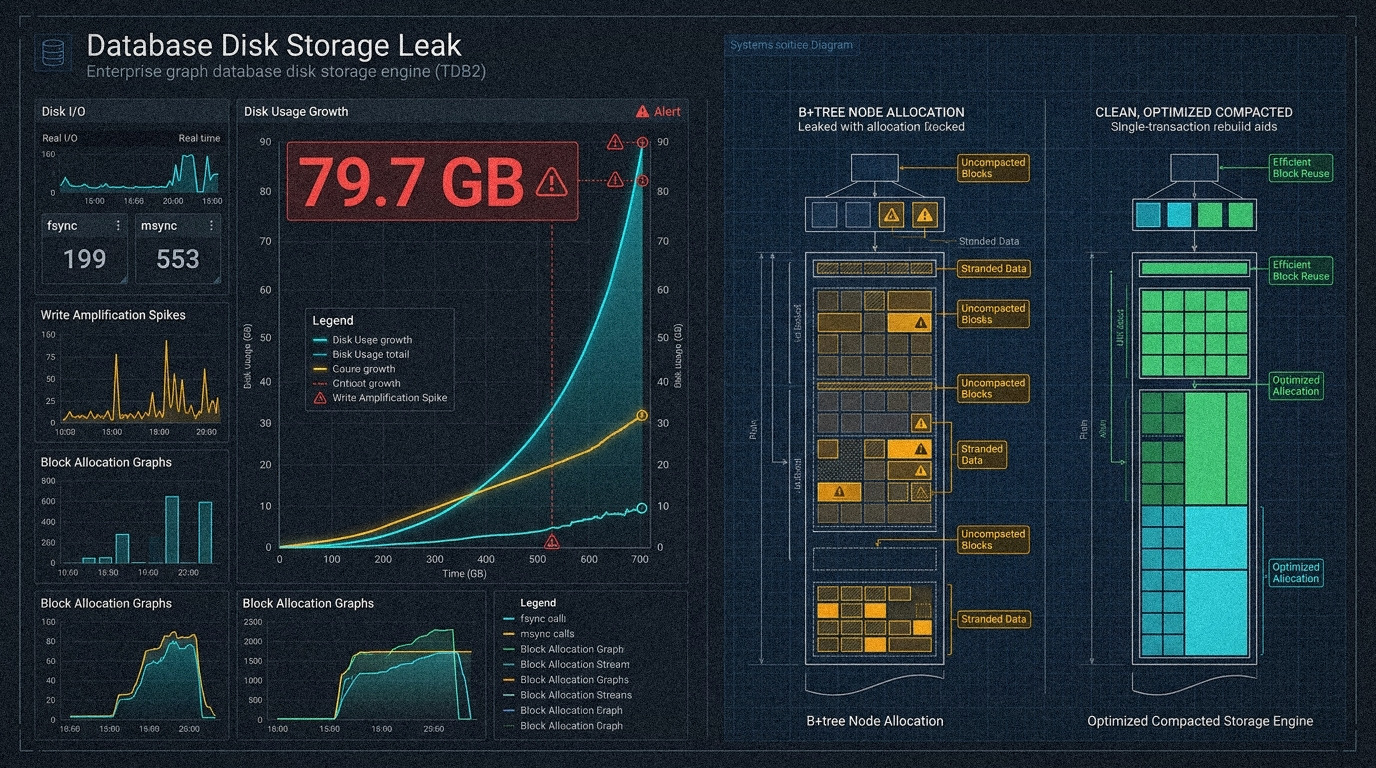
During an October 2026 storage profiling campaign, Wikantik’s embedded Apache Jena TDB2 graph store was measured at 79.7 gigabytes on a staging instance hosting an 18-megabyte documentation corpus.
Operating system syscall tracing via strace -f and Java Flight Recorder (JFR) file-force metrics confirmed that the directory (Data-0001) had accumulated uncompacted copy-on-write blocks at an average rate of 1.25 GB per day.
This analysis details the storage allocation mechanics in Jena TDB2, the transaction boundaries that triggered excessive I/O synchronization, and the multi-stage repair deployed in release 2.4.62.
Mechanism of TDB2 Disk Space Allocation
Apache Jena TDB2 persists RDF triples across specialized tuple indexes backed by copy-on-write B+trees. Unlike relational database engines that update fixed-size 8KB pages in place and rely on Write-Ahead Logging (WAL) for crash recovery, TDB2 does not overwrite dirty blocks during updates or deletions.
Instead, modifying an entity triple or named graph appends new B+tree root nodes and leaf entries to the end of the data file, marking obsolete blocks as inactive. Reclaiming physical disk space requires an explicit compaction operation, which copies live triples into a new generation directory (Data-0002) and removes the obsolete generation.
In milestone 2.4.58, an automated background compaction scheduler was configured as follows:
// OntologyRebuildScheduler.java (v2.4.58)
executor.scheduleAtFixedRate(this::compact, 168, 168, TimeUnit.HOURS);
The scheduler initialized with a delay of 168 hours (7 days). Because the production continuous delivery pipeline redeployed the Docker container every 3 to 5 days, the JVM process terminated before the initial 168-hour timer elapsed. As a result, automated compaction never executed in production.
Syscall profiling also identified severe write amplification during manual and automated ontology rebuilds. In OntologyRebuildService, the rebuild loop cleared the graph store and committed a distinct write transaction for each named graph across 8,733 graphs.
Each transaction commit executed an fsync across approximately 30 index files. A full rebuild produced 279,472 fsync and 122,282 msync calls, holding the JVM in I/O wait for 338 seconds and writing 16.6 gigabytes of dirty B+tree pages to disk for an 18 MB data set.
Remediation in Version 2.4.62
Resolving the disk growth and I/O bottlenecks required changes across three functional areas:
1. Single-Transaction Atomic Rebuilds
The per-graph transaction loop was eliminated in commit 6ae6708128. Rebuilding the 8,733-graph ontology now executes within a single write transaction.
The service also computes SHA-256 content hashes of the underlying documents before initiating writes: unchanged graphs are bypassed, committing zero bytes. Complete cold-start rebuild duration decreased from 390 seconds to 3.1 seconds, reducing physical disk writes from 16.6 GB to 16.4 MB.
2. Persisted Compaction State Markers
To decouple compaction schedules from container uptime, OntologyRebuildScheduler was updated to persist a state marker file (last-compacted.timestamp) to disk.
During JVM initialization, the scheduler inspects this timestamp. If more than 7 days have passed since the previous compaction—or if no marker exists—compaction is scheduled to run 5 minutes after application boot, allowing initialization to finish before cleaning up unreferenced B+tree blocks.
3. Asynchronous Page Synchronization
In earlier versions, saving a wiki page synchronously triggered up to 4 TDB2 write transactions on the HTTP request thread, generating 170 fsync/msync calls and adding 180ms to 277ms of latency.
Release 2.4.62 moved ontology synchronization to a background worker queue with a configurable coalescing window (wikantik.ontology.coalesceMs). The HTTP response returns immediately after the local markdown file write commits, reducing average page save latency to 17ms–42ms.
Telemetry Comparison
The table below compares storage and execution metrics between versions 2.4.61 and 2.4.62 under identical load testing scenarios:
| Metric | Before (v2.4.61) | After (v2.4.62) | Delta |
|---|---|---|---|
| Ontology Rebuild Duration | 390 seconds (6.5 min) | 3.1 seconds | −99.2% |
| Syscalls per Rebuild (fsync + msync) | 401,754 | 12 | −99.9% |
| Bytes Written per Rebuild | 16.6 GB | 16.4 MB | −99.9% |
| Page Save Latency (Request Thread) | 180ms – 277ms | 17ms – 42ms | −85.0% |
Systems Engineering Takeaway
Storage engines utilizing copy-on-write or append-only structures require explicit lifecycle management. When operating such engines in containerized environments with frequent restarts, compaction routines must rely on persistent state markers rather than in-memory uptime timers to avoid unbounded disk growth.
The next article examines database profiling results from PostgreSQL 18, detailing the identification and elimination of N+1 query patterns across audit and agent APIs.
Comments