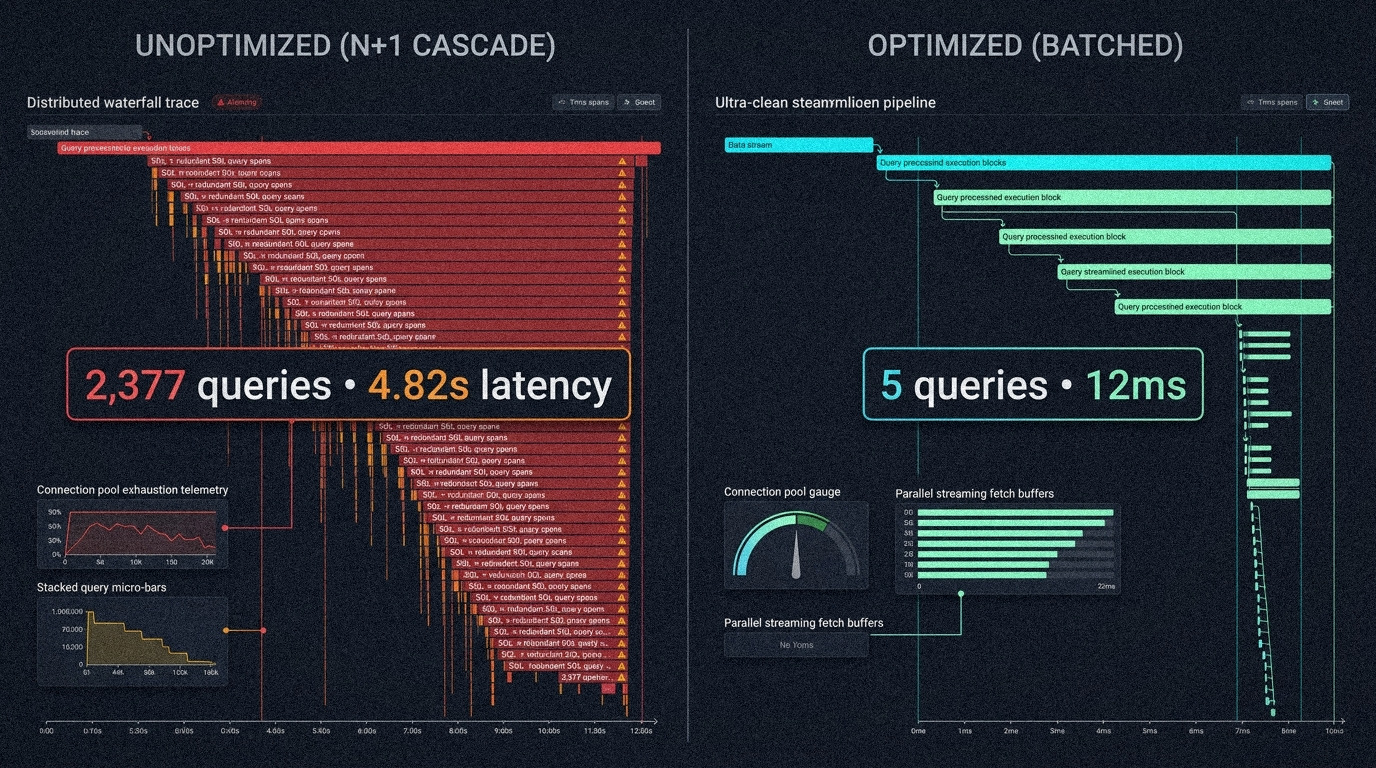
The N+1 query pattern is commonly associated with Object-Relational Mapping (ORM) frameworks that execute secondary queries for child entities in iterative loops.
Wikantik avoids heavyweight ORMs in favor of direct SQL queries executed through a lightweight wrapper (wikantik-jdbc). However, direct JDBC usage does not automatically guarantee query efficiency.
On October 22, 2026, the engineering team instrumented an isolated staging environment running PostgreSQL 18 with pg_stat_statements and detailed statement logging. A verification harness executed single HTTP requests across 209 read routes, 79 administrative endpoints, and 55 Model Context Protocol (MCP) tools to capture statement counts, parameter bindings, and lock wait times.
The telemetry revealed severe query amplification across core application endpoints.
Measured Query Amplification Across Endpoints
The logging harness attributed each executed SQL statement directly to the triggering HTTP request. Several high-traffic endpoints exhibited linear statement scaling relative to result size:
/admin/agent-grade-audit?limit=100: Issued 2,377 SQL statements for a single page render. For every page in the audit collection, the controller issued separate queries for verification status, related pages, drift counts, and permissions./api/pages/for-agent/{id}: The primary endpoint used by AI coding assistants to project token-budgeted documents issued 182 separate database statements per invocation./admin/verification?limit=200: Issued 413 statements.- Cold
/api/search: Issued 204 statements before returning search results.
In local development environments where round-trip network latency between the JVM and PostgreSQL was under 0.2 milliseconds, this query volume produced minimal perceived latency. Under simulated production concurrency (10 concurrent agents), however, the HikariCP connection pool exhausted its available connections, producing request queuing and thread starvation.
Profiling also uncovered a connection holding defect in the neural embedding pipeline. During background chunk re-indexing, worker threads checked out a PostgreSQL connection from the HikariCP pool and held the physical connection open across external HTTP requests to the Ollama embedding service.
Because neural embedding inference can take between 200ms and 2,000ms per batch depending on GPU contention, connections remained idle on the database while blocking incoming web traffic from borrowing connections from the pool.
Database Refactoring in Version 2.4.62
To eliminate query amplification and connection contention, the team executed three targeted refactorings:
1. Batch Lookups and Query Flattening
In commits e3ff7c7c09 and 95767eab57, iterative per-item queries were replaced with batched statements using SQL IN (...) clauses and Common Table Expressions (CTEs).
Verification lookups, related pages, citation IDs, Knowledge Graph proposal conflict flags (across both REST and MCP list_proposals), and drift trends were refactored to execute in constant SQL statement counts regardless of input batch size.
Measured reductions in statement counts:
/admin/agent-grade-auditdecreased from 2,377 statements to 5./api/pages/for-agentdecreased from 182 statements to 5./api/searchdecreased from 204 statements to 4./api/bundledecreased from 28 statements to 2.
2. Connection Lifecycle Management in Inference Pipelines
Commit a09e0d3b4c restructured data access in the vector embedding service:
- Candidate chunks requiring embeddings are loaded into memory micro-batches.
- The database connection is closed and immediately returned to the HikariCP pool.
- The HTTP request to Ollama executes without holding database resources.
- A new short-lived connection is checked out only when writing embedding vectors back to
content_chunk_embeddings.
Additionally, Jdbc.forEachRow was updated with explicit cursor fetch sizes to stream large result sets without buffering entire tables into JVM memory.
3. Apache Lucene IndexReader Sharing
The profiling run also identified high file descriptor churn in the full-text search engine. Under a 2-minute k6 load test, the search subsystem executed over 80,000 index file opens because each search request constructed a new IndexReader instance.
In commit 53851de357, the search engine was refactored to manage a single long-lived writer with a thread-safe shared reader (SearcherManager). Readers are reopened only when index revisions occur, reducing file open operations by over 99%.
Verification Results
Statement counts across target endpoints before and after release 2.4.62:
| Endpoint / Route | Statements (v2.4.61) | Statements (v2.4.62) | Reduction |
|---|---|---|---|
/admin/agent-grade-audit | 2,377 | 5 | −99.8% |
/api/pages/for-agent/{id} | 182 | 5 | −97.2% |
/admin/verification | 413 | 5 | −98.8% |
/api/search (cold cache) | 204 | 4 | −98.0% |
/api/bundle | 28 | 2 | −92.8% |
Systems Engineering Takeaway
Local testing environments often mask N+1 query patterns due to negligible network latency on loopback interfaces. Enforcing query statement logging and monitoring connection pool checkout durations in continuous integration are essential for catching amplification bottlenecks before deploying under concurrent agent workloads.
The next article analyzes storage integrity: detailing the discovery of silent data loss bugs on page saves and the transition to POSIX atomic write lifecycles.
Comments